Getting Started
Our ‘Getting Started’ example consists of a simple application that displays a list of tasks, their status, and the relationship between them in a HTML page.
The main steps to integrate Sprotty into our application are as follows:
- Set-up your application.
- Define your model by creating sub-interfaces of
SModelElement. - Implement views to generate SVGs for each type of model element.
- Configure the diagram through dependency injection.
- Connect to a model source, either local or remote
If you’d like to skip the manual steps below and create a Sprotty-based project right away, you can use the Yeoman generator:
npm install -g yo generator-sprotty
yo sprotty
Answer a few questions and you’ll get a ready-to-use example project.
Our example application is based on TypeScript. In this application we will set up our project to be ready for receiving Sprotty.
Create a new directory and navigate to it
Initialize the project by running
npm init -yThis will create a
package.jsonfile.Modify
package.jsonto add a build script and necessary dependencies{ "scripts": { "build": "esbuild ./index.ts --bundle --sourcemap --outfile=./out/index.js" }, "devDependencies": { "esbuild": "^0.17.8", "typescript": "^4.9.5" }, "dependencies": { "reflect-metadata": "^0.1.13", "sprotty": "^1.0.0" } }Install dependencies running
npm iInitialize the TypeScript project
npx tsc --initThis will create
tsconfig.jsonfile at the root of your project. You should overwrite this files with the following:{ "$schema": "https://json.schemastore.org/tsconfig", "compilerOptions": { "target": "ES2019", "module": "commonjs", "esModuleInterop": true, "sourceMap": true, "experimentalDecorators": true, "jsx": "react", "types": [ "reflect-metadata" ] }, "lib": [ "ES2019", "DOM" ] }Create a
index.htmlfile at the root of your project<head> <script src="./out/index.js" type="text/javascript"></script> <link rel="stylesheet" href="styles.css" /> </head> <body> <div id="sprotty-container"></div> </body>Add some default CSS styles by creating a
styles.cssfile at the root of the project:.sprotty-graph { width: 100%; height: 100%; } .sprotty-edge { fill: none; stroke: black; stroke-width: 1px; }
Our project is now set-up and ready for integrating Sprotty diagrams.
Sprotty comes with a set of model classes that you can reuse for your application. e.g. SNodeImpl and SEdgeImpl for graphs and SChildElementImpl for other views. However, it is often necessary to add application-specific properties to model elements, so their graphical views can be parameterized.
We will define a new interface for our nodes called TaskNode, extending Sprotty’s SNode interface with application-specific properties. Create a new file models.ts at the root of the project:
import { SNode } from "sprotty-protocol"

export interface TaskNode extends SNode {
    name: string;
    isRunning: boolean;
    isFinished: boolean;
}
A view maps a model element to its graphical representation. You can create your own views by creating a class implementing IView or extending a view already available in Sprotty.
In the following example we use the JSX syntax to create a SVG group with a rect and a text element. Add a new file views.tsx (note the tsx extension) at the root of the project:
/** @jsx svg */
import { svg } from 'sprotty/lib/lib/jsx';
import { injectable } from 'inversify';
import { VNode } from 'snabbdom';
import { IView, RenderingContext, SNode } from 'sprotty';
import { TaskNode } from './models';

@injectable()
export class TaskNodeView implements IView {
    render(node: Readonly<SNode & TaskNode>, context: RenderingContext): VNode {
        const position = 50;
        return <g>
            <rect class-sprotty-node={true} class-task={true}
                class-running={node.isRunning}
                class-finished={node.isFinished}
                width={node.size.width}
                height={node.size.height}
            >
            </rect>
            <text x={position} y={position + 5}>{node.name}</text>
        </g>;
    }
}
The SVG elements are styled with CSS using classes that are injected using the class-myClass={boolean expression} in the jsx expression. Add the following to styles.css:
.sprotty-node.task {
    fill: #c0e0fc;
    stroke: #444;
    stroke-width: 1;
}

.sprotty-node.task.running {
    fill: #f00;
}

.sprotty-node.task.finished {
    fill: #0f0;
}

text {
    stroke-width: 0;
    stroke: #000;
    fill: #000;
    font-family: sans-serif;
    font-size: 10pt;
    text-anchor: middle;
}
The configuration of our Sprotty application is done via Dependency Injection using InversifyJS. We recommend defining your InversifyJS container in a file named di.config.ts at the root of the project which could look like this:
import { Container, ContainerModule } from 'inversify';
import { configureModelElement, configureViewerOptions, loadDefaultModules, LocalModelSource, PolylineEdgeView, SEdgeImpl, SGraphImpl, SGraphView, SNodeImpl, TYPES } from 'sprotty';
import { TaskNodeView } from './views';

export const createContainer = (containerId: string) => {
    const myModule = new ContainerModule((bind, unbind, isBound, rebind) => {
        bind(TYPES.ModelSource).to(LocalModelSource).inSingletonScope();

        const context = { bind, unbind, isBound, rebind };
        configureModelElement(context, 'graph', SGraphImpl, SGraphView);
        configureModelElement(context, 'task', SNodeImpl, TaskNodeView);
        configureModelElement(context, 'edge', SEdgeImpl, PolylineEdgeView);

        configureViewerOptions(context, {
            needsClientLayout: false,
            baseDiv: containerId
        });
    });

    const container = new Container();
    loadDefaultModules(container);
    container.load(myModule);
    return container;
};
Views are registered using configureModelElement which takes a context, a type, an element class, and a view.
loadDefaultModules is used to include Sprotty’s default modules, while container.load can be used to include extra modules required by our application.
Sprotty supports two kinds of model sources:
LocalModelSourceallows to create models directly in TypeScript or JavaScriptWebSocketDiagramServerdelegates to a remote source that is connected via a web socket
In this example, we consider the local variant. To enable the model source, we add the following line to our module definition (see previous section):
bind(TYPES.ModelSource).to(LocalModelSource).inSingletonScope()
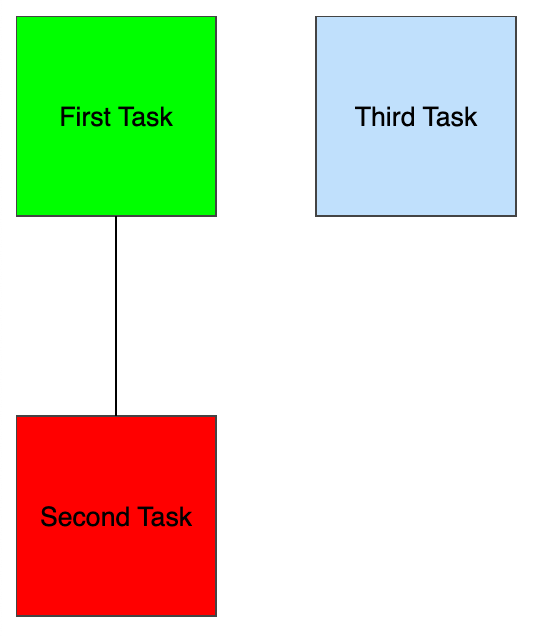
Afterwards you can use the LocalModelSource to initialize and update the model. For example, the following graph consists of three task nodes with a connection between the first two. Create a new file model-source.ts at the root of the project:
import { SGraph, SEdge, SNode } from "sprotty-protocol";
import { TaskNode } from "./models";

export const graph: SGraph = {
    type: 'graph',
    id: 'graph',
    children: [
        <SNode & TaskNode>{
            type: 'task',
            id: 'task01',
            name: 'First Task',
            isFinished: true,
            isRunning: false,
            position: { x: 0, y: 0 },
            size: { width: 100, height: 100 }
        },
        <SNode & TaskNode>{
            type: 'task',
            id: 'task02',
            name: 'Second Task',
            isFinished: false,
            isRunning: true,
            position: { x: 0, y: 200 },
            size: { width: 100, height: 100 }
        },
        <SNode & TaskNode>{
            type: 'task',
            id: 'task03',
            name: 'Third Task',
            isFinished: false,
            isRunning: false,
            position: { x: 150, y: 0 },
            size: { width: 100, height: 100 }
        },
        <SEdge>{
            type: 'edge',
            id: 'edge01',
            sourceId: 'task01',
            targetId: 'task02',
            routerKind: 'manhattan',
        }
    ]
};
Finally, we need to create the entry point of our application in an index.ts file:
import "reflect-metadata";
import { LocalModelSource, TYPES } from 'sprotty';
import { createContainer } from './di.config';
import { graph } from './model-source';

export default function run() {
    const container = createContainer("sprotty-container");
    const modelSource = container.get<LocalModelSource>(TYPES.ModelSource);
    modelSource.setModel(graph);
}

document.addEventListener("DOMContentLoaded", () => run());
That’s it! Run npm run build and open your HTML file, you should see the following diagram! There is some level of interactivity by default, try it out! Select nodes by clicking on them and move them around by dragging, adjust the zoom-level with the mouse wheel, navigate the diagram by panning via left-click and drag outside of a node.