
Putting It Together
The moment of truth has arrived! In this final section, we’ll connect all the pieces we’ve built and bring our interactive diagram to life.
First, we need to create an entry point that initializes our diagram when the page loads. This file will:
- Set up the dependency injection container
- Load our model data
- Render the diagram in the browser
Create a new file called index.ts in your src directory:
import 'reflect-metadata';

import { LocalModelSource, TYPES } from 'sprotty';
import createContainer from './di.config';
import { graph } from './model-source';

document.addEventListener('DOMContentLoaded', () => {
    const container = createContainer('sprotty-diagram');
    const modelSource = container.get<LocalModelSource>(TYPES.ModelSource);
    modelSource.setModel(graph);
});
Let’s break down what’s happening in this file:
import 'reflect-metadata';
import { LocalModelSource, TYPES } from 'sprotty';
import createContainer from './di.config';
import { graph } from './model-source';
reflect-metadatais required by InversifyJS for dependency injectionLocalModelSourceandTYPESare imported from SprottycreateContaineris our dependency injection configurationgraphis our diagram model data
document.addEventListener('DOMContentLoaded', () => {
    const container = createContainer('sprotty-diagram');
    const modelSource = container.get<LocalModelSource>(TYPES.ModelSource);
    modelSource.setModel(graph);
});
This code:
- Waits for the DOM to be fully loaded
- Creates a dependency injection container with our configuration
- Gets the
LocalModelSourcefrom the container - Sets our graph model as the source data
💡 Pro Tip: The
'sprotty-diagram'parameter passed tocreateContainermust match the ID of the HTML element where you want your diagram to appear.
Now that all the pieces are in place, let’s build and run our application!
Your project should now have the following structure:
hello-world/
├── node_modules/
├── package.json
├── package-lock.json
├── src/
│   ├── di.config.ts
│   ├── index.ts
│   ├── model.ts
│   ├── model-source.ts
│   └── views.tsx
├── static/
│   ├── index.html
│   └── styles.css
└── tsconfig.json
Run the build script to compile and bundle your TypeScript code:
npm run build
This will create an index.js file in your static directory.
Open the static/index.html file in your browser. You should see your interactive diagram with three task nodes and a connection between the first and second tasks!
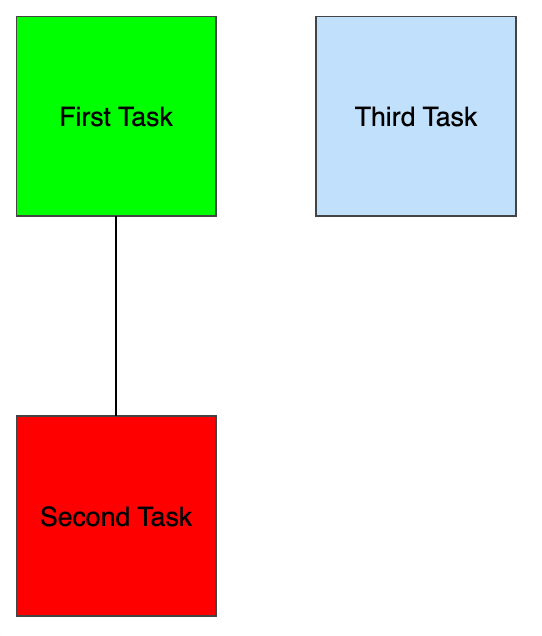
Take a moment to interact with your diagram:
- Click on a task node to select it (notice the border gets thicker)
- Hover over nodes and edges to see hover effects
- Observe the different colors representing task states:
- Green for finished tasks
- Red for running tasks
- Blue for waiting tasks
Congratulations! You’ve successfully built a complete Sprotty diagram application from scratch. Let’s review what you’ve learned:
- Project Setup - Creating a TypeScript project with the necessary dependencies
- Data Model - Defining custom node types and a diagram structure
- Custom Views - Creating SVG-based renderers for your diagram elements
- Dependency Injection - Wiring everything together with InversifyJS
- Application Initialization - Creating an entry point that loads and renders your diagram